- Research article
- Open access
- Published:
16S rRNA gene sequencing of mock microbial populations- impact of DNA extraction method, primer choice and sequencing platform
BMC Microbiology volume 16, Article number: 123 (2016)
Abstract
Background
Next-generation sequencing platforms have revolutionised our ability to investigate the microbiota composition of complex environments, frequently through 16S rRNA gene sequencing of the bacterial component of the community. Numerous factors, including DNA extraction method, primer sequences and sequencing platform employed, can affect the accuracy of the results achieved. The aim of this study was to determine the impact of these three factors on 16S rRNA gene sequencing results, using mock communities and mock community DNA.
Results
The use of different primer sequences (V4-V5, V1-V2 and V1-V2 degenerate primers) resulted in differences in the genera and species detected. The V4-V5 primers gave the most comparable results across platforms. The three Ion PGM primer sets detected more of the 20 mock community species than the equivalent MiSeq primer sets. Data generated from DNA extracted using the 2 extraction methods were very similar.
Conclusions
Microbiota compositional data differed depending on the primers and sequencing platform that were used. The results demonstrate the risks in comparing data generated using different sequencing approaches and highlight the merits of choosing a standardised approach for sequencing in situations where a comparison across multiple sequencing runs is required.
Background
The release of the first commercial next-generation sequencer in 2004, the Roche 454 pyrosequencer, resulted in an exponential increase in studies investigating the composition of microbiota in diverse and complex environments. Although Roche 454 platforms were employed in numerous important and enlightening human microbiome studies [1–4], the Illumina MiSeq [5] and Life Technologies Ion PGM [6] platforms are now most commonly used for 16S rRNA gene-based investigations of microbiota composition [7–11]. The decision as to which sequencing platform to utilise for a given study frequently depends on requirements and resources, which vary based on the technology used, the cost/run, data output, amplicon size tolerated, data storage capabilities and error rates.
In order to achieve accurate sequencing results, many factors have to be considered when designing a sequencing study. Numerous studies have investigated the effects of different factors on 16S rRNA gene microbiota data including, in the case of gut microbiota studies, sample type [12] (e.g. faecal vs. cecal), sample storage prior to DNA extraction [13], DNA extraction procedure [14, 15], primers (sequences and 16S rRNA gene regions) [16–18] and the sequencing platform used [19]. This study aims to look at the effects of a combination of 3 factors on sequencing results, namely, 3 different 16S rRNA gene primer sets, use of the Illumina MiSeq and Life Technologies Ion PGM sequencers and comparison of 2 commonly used extraction procedures (QIAamp DNA Stool Mini Kit compared to the repeat bead beating (RBB) method [20] with elements of the Qiagen faecal extraction kit). Regions of the 16S rRNA bacterial gene are most commonly sequenced when using next generation sequencing to study the bacterial composition of an environment. This approach is extremely useful, as even poor quality or low concentrations of DNA can be successfully amplified by degenerate primers and PCR to facilitate sequencing of a region or regions of the 16S rRNA gene, allowing sequencing of diverse populations without prior selection for microbes of interest (as in the case of culture based approaches). However, the particular variable region targeted and primer pair used can impact on the results achieved [21] and the ability of researchers to compare data generated from different sequencing studies. Recent studies have shown the region of the 16S rRNA gene that is sequenced will impact on the results achieved [22].
With respect to the choice of sequencing platform, the two sequencers in question utilise different technologies, which may affect the sequencing results achieved. Briefly, Illumina’s MiSeq is a bench-top version of the HiSeq platform, manufactured by the same company [23]. This platform enables ‘paired-end’ sequencing, is cost effective and can achieve 2 × 300 bp paired read lengths. In contrast, the Ion PGM sequencer utilises semiconductor technology through the real time detection of hydrogen ion concentration [6]. Currently, the Ion PGM produces read lengths of approximately 400 bp in length. As research using high-throughput sequencing continues, there is a need for studies to optimise accuracy while minimising, and where possible eliminating, sequencing bias. While individual studies have compared different primers [17, 21], extraction procedures [14] and sequencing platforms [19], here our aim is to investigate the individual and cumulative effects these 3 factors have on 16S rRNA gene-based investigations of bacterial composition. More specifically, by using a mock community DNA sample and mock community cells for DNA extraction, both with a predetermined composition, we aim to identify which factor(s) have the greatest effects on sequencing results achieved. Thus, our aim was to determine which extraction procedure, region of the 16S rRNA gene and sequencing platform yield results that most accurately reflect the known ratios of bacteria/bacterial DNA in the mock communities. The choice of the V4-V5 and V1-V2 regions to target with our primers was based on the frequency with which they are currently used in such research, thus there is a need to determine which, if either, provides the most accurate results. Our results revealed that the 3 Ion primers detected more of the expected mock communities than was the case when the corresponding MiSeq primers were employed. Ultimately, the choice of PCR primers and sequencing platform had a more notable impact on the results than either of the DNA extraction methods. These results will be of value to researchers when planning future 16S rRNA gene-based microbiota analyses.
Results
Sequencing data quality analysis
Mock community DNA (HM-782D) and DNA extracted from mock community cells (HM-280/1) was sequenced on the MiSeq and Ion PGM platforms. Details on numbers of sequencing reads, read lengths and percentage of reads retained following quality filtering and chimera removal are provided in Table 1. The percentage of retained reads was similar across platforms and primer sets, with the notable exception of the V4-V5 primers on the Ion PGM, where 80–90 % were retained following chimera removal, compared to an average of 99 % retained for the other primers on both platforms. Rarefaction curves (Fig. 1) demonstrate that the majority of curves begin to plateau, thus additional sequencing is unlikely to yield novel data in most cases.

Rarefaction curves based on sample ID and number of observed species for mock cells (a) and mock DNA samples (b). Curves are approaching or are horizontal with the x axis indicating that additional sequencing would not yield additional novel data
Effects of primers and sequencing platform on mock DNA results
It was anticipated that sequencing of the mock DNA (HM-782D) would reveal the presence of 20 species, based on compositional details from the supplier (BEI resources). The 3 primer sets differed in the number of species detected relative to the number of anticipated species present in this DNA sample. The V4-V5 PGM combination was the only combination that detected the template DNA from all of the 20 mock community species (Table 2). In general, the 3 Ion PGM primer sets detected more of the 20 mock community species than the equivalent MiSeq primer sets. There were also a number of instances of mis-identification i.e. where taxa not represented in the mock community DNA were detected. The mis-identified species were, in the majority of cases, closely related to species known to be present in the mock samples (e.g. E. faecium detected but E. faecalis DNA is present in the mock DNA sample. The SPINGO species classifier highlights that these species share 96.4 % species alignment). Figure 2 more specifically highlights the differences in the data generated. As can be seen in Fig. 2, all primers gave results that differed from those expected for the mock DNA community. The V4-V5 primers gave the most comparable results across platforms while the V1-V2 degenerate primer set used on the Ion PGM platform gave results that most closely matched those expected of an even mock community distribution of 20 species.
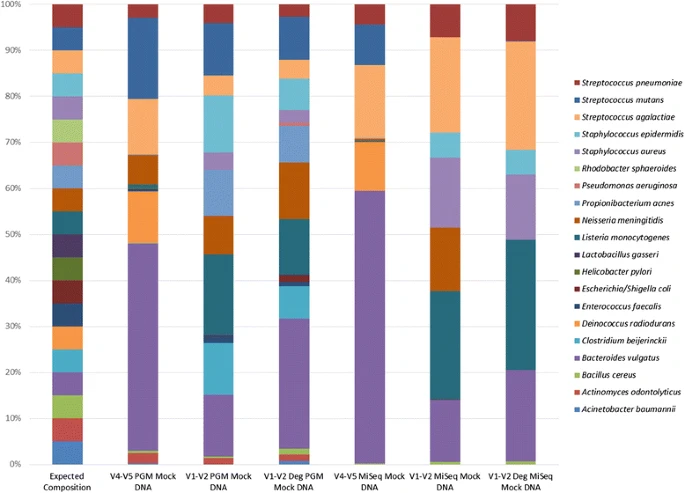
Percentage relative abundance of expected species (n = 20) detected in mock community DNA based on sequencing platform and primer set used
Other analyses were carried out to highlight the impact of primer selection and sequencing platform on the outcome of studies. A heat map of taxa abundance (Fig. 3) was generated using Spearman correlations and Ward Clustering. The results highlighted that samples separated based on sequencing platform used, with MiSeq (blue) to the left and Ion PGM (green) to the right. This is with the exception of the MiSeq V4-V5 primer which clusters with the V4-V5 Ion PGM primers. Hence the use of this primer pair is less influenced by platform choice.

Heat map of species abundance. Only the 20 expected taxa from mock DNA (HM-782D) were included. Hierarchical clustering was performed using hclusing default parameters (complete linkage). The blue colours represent samples sequenced on MiSeq platform while green represent the Ion PGM
Effects of extraction procedure on sequencing results achieved
Having demonstrated the effects of both 16S rRNA gene primer choice and sequencing platform on results, we next aimed to determine the effects of DNA extraction procedures on the sequencing results achieved. As shown in Fig. 4 and Additional file 1, the relative abundances of species detected was more dependent on the primers and platform used, rather than on the choice of extraction procedure. Notable differences occurred based on storage agent (i.e. between glycerol ± PBS), namely the glycerol stocked cells had a higher relative abundance of Streptococcus, Clostridium and Listeria compared to the PBS + glycerol cells. This was true for sequencing results from both platforms and all primers except using V4-V5 primers on the Ion PGM where similar levels of these bacteria were seen between all extracts. Additionally, V4-V5 MiSeq RBB extracted PBS cells were quite different to either the V4-V5 Qiagen extracted glycerol and RBB glycerol cells. Additionally, the Qiagen PBS extracted DNA failed to amplify with the MiSeq V4-V5 primers, while other primers amplified this DNA. Thus perhaps inhibitors in this sample interacted more strongly with these primers preventing PCR amplification. These results suggest subtle differences occur in sequencing data as a result of sample storage agent and DNA extraction protocol used.

Percentage relative abundance of expected species based on extraction procedure
As was seen for the mock DNA, the different primer sets impacted on the species detected in the mock cells. There was a strong impact of primer choice on the results, with samples amplified with the same primers being more similar than those amplified with different primers. Extraction method had a lesser effect on overall composition, with samples extracted using the RBB or the Qiagen method and amplified with the same primer, yielding similar results. Additionally, as shown in Fig. 5, the samples do not show clustering based on extraction method, with samples extracted using different extraction procedures, but amplified with the same primers yielding similar results.

Heat map of species abundance by sequencer and extraction method for mock community cells. Only expected taxa were included and hierarchical clustering was performed using hclust default parameters (complete linkage). The top colour legend depicts the sequencing technology and primer set. The blue colours represent samples sequenced on MiSeq platform while green represent the Ion PGM. The bottom legend represents the samples and extraction method
We anticipated that 22 species would be detected from the DNA extracted from the mock community cells, however, bioinformatic analysis again indicated the presence of species known not to be within the mock community. None of the primer sets, when used on the MiSeq platform (irrespective of extraction method or storage agent), detected all 22 expected species (Table 2). Indeed the best performing primer sets only detected 77 % of the expected species (V4-V5 Qiagen glycerol and V1-V2 RBB glycerol extracts). All primer pairs used with the Ion PGM platform detected a greater percentage of expected species (77–100 %) compared to the corresponding primers used on the MiSeq (55–77 %). The V1-V2 degenerate Ion PGM primers used on the RBB glycerol extracted cells detected 100 % of the expected species.
The heat map for the mock cells gave similar results as for the mock community DNA (Fig. 5). The V4-V5 amplified samples cluster together irrespective of extraction procedure or sequencing platform used, with the exception of the RBB PBS V4-V5 MiSeq sample that clustered with the V1-V2 amplified samples. Observing the coloured line indicating the extraction method, it is evident that there is clustering by primer set used and not by extraction method. The heat map also shows how species abundances differed across samples with primer choice, rather than extraction method, appearing to cause differences in species detected between samples.
Discussion
With the rapid increase in studies investigating the microbiota of diverse environments using high-throughput sequencing approaches, it is critical that the impact of numerous factors on the sequencing results be determined. This study analysed the effects of DNA extraction procedures, 16S rRNA gene primer design and the choice of sequencing platform on outcomes using mock community cells and DNA.
The vast majority of sequencing studies have relied on sequencing of the 16S rRNA gene to determine the bacteria present in an environment [1, 3]. Previous studies have also examined the effects of primers on sequencing outcomes by amplifying the V1-V3, V3-V5 and V6-V9 regions of the 16S rRNA gene from the same mock community cells as used in this study (HM 280/1) and sequencing using Sanger and 454-pyrosequencing platforms [16]. They also noted the effect of the region of the 16S rRNA gene targeted on sequencing data. Our study used primers targeting the V4-V5 and V1-V2 regions and employed the Illumina MiSeq and Ion PGM platforms. Despite both studies using the same mock community cells (HM 280/1), differences occurred between our data sets, likely due to a combination of primer and sequencer effects. Similar to the study by Haas et al., our study also noted non-uniform relative abundances in the mock communities. The results demonstrated that the V4-V5 primers gave the most comparable results across platforms, which could be of benefit to researchers moving between newer sequencing platforms. However, this result must also be considered in light of the fact that the same primer sets gave skewed abundances. Thus while this primer set gave the most comparable results across platforms suggesting it is least affected of the primers sets by platform used, the results still show discrepancies between the anticipated and achieved results with this primer set. The results from the V1-V2 and V1-V2 degenerate primers were distinct from the V4-V5 primers and differed in their detection of species. Considerable differences occurred based on which primer and platform was used. Only two combinations, namely the V4-V5 Ion PGM primers used on the mock DNA and the V1-V2 degenerate Ion PGM primers used on the RBB glycerol cells, detected 100 % of the expected species. It is worth noting that the same primers used on other extracted or mock DNA templates did not detect 100 % of the expected species, thereby again highlighting that the results are due to a combination of factors, including DNA extraction procedure, primer choice and sequencing platform. Furthermore, no primer set detected the expected species exclusively and all gave false hits (% of reads achieved that were not expected relative to total reads achieved) (varying from 6 % for the Ion PGM V1-V2 Qiagen PBS sample to 69 % for the Ion PGM V1-V2 degenerate Qiagen PBS sample). These were present at very low relative abundances and were closely related to the actual species present in the mock communities, thus we suggest they were mis-assigned at species level, due to similarities in their 16S rRNA gene sequence e.g. E. faecalis present in the mock community but E. faecium also assigned at species level. Based on these findings it appears that the primers consistently performed best on the Ion PGM platform, with higher percentages of expected species detected and lower false hits compared to the MiSeq platform. A recent study also took a similar approach to ours and compared the results of a mock community sequenced using primers targeting the V1-V2 region and sequenced on the MiSeq and Ion PGM platforms [19]. The study found the relative abundances to be generally in agreement with the expected community composition and the results to be similar across platforms. While our study did not analyse replicates (due to limitations in starting material), Salipante et al. did not find significant differences between replicates, which is consistent with previous findings also [24]. Our findings are similar to those of Tremblay et al. [22] who also showed differences in sequencing results on the 454-pyrosequencer and the MiSeq when different regions of the 16S rRNA gene were targeted, using a mock microbial community. In this instance, the authors compared the V4, V6-V8 and V7-V8 regions and found that the V4 primers gave the least biased results. We also found the V4-V5 primer set to yield the most comparable results across platforms. The authors also highlight that currently there is no consensus on which primer set yields the best result; therefore they suggest the potential to use shotgun metagenomics to interrogate your dataset and to compare the results with that of your different primer sets under investigation. However, due to cost this is still not a feasible approach for most studies but could be used perhaps to select between primer sets prior to commencing a series of sequencing-based studies.
This study also conducted a direct comparison of the MiSeq and Ion PGM platforms, both of which are being used increasingly for 16S rRNA amplicon sequencing studies. The results indicated that not only the depth of sequencing achieved differs by platform, but also the percentage of retained sequences following quality filtering and chimera removal. We found the lowest percentage of reads was retained from the V4-V5 primer sequences from the Ion PGM (80–90 % retained following chimera removal compared to an average of 99 % retained for the other primers on both platforms). This may be due to the fact that these were the longest reads achieved on the Ion PGM at 380–400 bp. Currently 400 bp is the longest read length supported by this platform and although we achieved longer read lengths with this primer set, the quality of these reads was considerably lower than the shorter reads with the V1-V2 primer sets (335–355 bp), resulting in increased numbers of reads being removed during quality filtering and chimera removal. This study has clearly shown the impact of sequencing platform on the results achieved, a finding also observed in a previous study [22] which showed that samples clustered by sequencing platform used. A recent study also compared the MiSeq and Ion PGM platforms for sequencing a mock microbial community using V1-V2 16S rRNA primers [19]. Our results are in agreement with this previous study that both platforms offer good sequencing depth and are a good alternative to older platforms. However, they noted that more studies looking at different regions of the 16S rRNA gene were needed to fully comprehend the impact these factors have on sequencing outcomes. This previous study also highlighted the potential to minimise sequencing artifacts using bidirectional sequencing and also through optimization of flow order on the Ion PGM platform. Again this study did not conclude as to which platform/primer combination gave the best results. Thus, we conclude that based on ours and previous data, the most suitable primer and platform to use for sequencing studies remains unclear. Perhaps the inclusion of mock communities or the comparison of 16S rRNA based data to shotgun metagenomic data may enable an optimised approach to be devised at the beginning of a large sequencing-based trial and there after the use of this optimised approach would limit variation between results within this trial. Thus we share the conclusions of Tremblay et al. [22] that based on all current knowledge, protocol consistency remains more pertinent to the study outcome than primer or sequencing platform choice.
DNA extraction procedure has a significant impact on sequencing results [25, 26]. Several studies have previously shown the effects of using different commercial kits for DNA extraction from faecal samples on sequencing outcomes [14, 15, 17]. Our approach was to focus specifically on just two extraction methods commonly used in microbiota studies to establish if the widely used Qiagen DNA extraction approach was as successful as the RBB approach or if the additional bead beating steps yielded more accurate results. Both extraction procedures yielded DNA that gave comparable results with respect to phylogeny. This may be due to the similarity in these approaches, while the use of a different commercial DNA extraction kit could yield significantly different results. Additionally, this study used mock community cells to investigate the effects of DNA extraction procedure. This is a relatively simple microbiota community relative to, e.g. faecal samples. Thus results suggesting that the extraction method has minimal effects on microbiota sequencing data could in fact be due to the ease of extraction of DNA from the mock community cells. While we have shown both DNA extraction procedures to yield similar sequencing results in this instance, it is our recommendation that the selection and use of just one DNA extraction method for longitudinal studies is vital to ensure differences in the data that may be observed are not occurring due to extraction bias.
Conclusions
This study provides a direct comparison of the Illumina MiSeq and Ion PGM sequencers and has shown that the MiSeq and Ion PGM sequencers offer good sequencing depth and provides information at species level, not attainable using older platforms. Given the demonstrated differences in microbiota composition due to primer choice and sequencing platform used, the need for the use of internal controls on sequencing runs is evident. Overall, our results are significant as they highlight important considerations for designing and interpreting sequencing studies. Thus as we enter an era of rapid sequencing development, advancement and improvement, it is of utmost importance to carefully consider, assess and continually review best practice regarding designing, conducting and interpreting microbiota sequencing studies.
Methods
PCR primers for 16S rRNA gene sequencing
PCR primers for 16S rRNA gene sequencing using the Illumina MiSeq sequencing platform were designed to consist of an Illumina adaptor sequence, a 12 nt index (barcode) sequence, a 10 nt primer pad region, a 2 nt linker region and the gene specific primer sequence (Table 3). Three primer sets, one targeting the V4-V5 region [23] and two primer pairs targeting the V1-V2 region of the 16S rRNA gene [4], with primer set 2 using a degenerate forward primer [17] were used for sequencing to determine the effect of primer design and the region of the 16S rRNA gene which is targeted, on the sequencing outcomes. A corresponding set of 3 primer pairs were generated for use on the Ion PGM platform and were designed to contain the Ion PGM linker sequence, a unique 10 nt Golay barcode sequence, a 2 nt spacer sequence and the gene specific sequence (Table 4).
Mock community DNA
To determine the effects of different primer sets, and different DNA extraction procedures on sequencing results, genomic DNA from Microbial Mock Community B (Even, Low Concentration), v5.1L, for 16S rRNA Gene Sequencing (HM-782D), and cells from Microbial Mock Community C in phosphate buffered saline (PBS) (HM-280) and in PBS and 40 % Glycerol (HM-281) were obtained through BEI Resources, NIAID, NIH as part of the Human Microbiome Project (Manassas, VA). Mock community DNA was used as template DNA for sequencing using 3 primer sets, per platform, as outlined below.
Metagenomic DNA extraction for PCR reactions
Mock community cells (HM-280/1) were used to ascertain the effects of extraction procedure on the sequencing results achieved, thus DNA was extracted from these cells using 2 DNA extraction procedures and DNA was subsequently amplified using 3 Illumina MiSeq and 3 Ion PGM primer sets. DNA was also extracted from mock community cells in PBS (HM-280) and those in PBS + glycerol (HM-281), thus determining if the storage agent of the cells prior to extraction has any effect on the results achieved. DNA was extracted from mock community cells, using previously described methods [2, 27]. Briefly, DNA was extracted from mock community cells (HM-280/1) using a QIAamp DNA Stool Mini Kit (Qiagen, Sussex, UK), with the addition of an initial bead beating step. DNA was also extracted using a RBB approach and a modified Qiagen DNA extraction procedure [13, 20]. Briefly, 1 ml of lysis buffer (500 mM NaCl, 50 mM Tris–HCl pH8.0, 50 mM EDTA and 4 % sodium dodecyl sulphate) was added to the bead beating tubes containing the mock community cell sample. Samples were homogenised for 3 mins at max speed using the Mini Bead beater. Samples were incubated at 70 °C for 15mins. Following centrifugation the supernatant was removed and the bead beating steps repeated. Following pooling of the supernatant, samples were treated with 10 M ammonium acetate (Sigma Aldrich, Ireland), the DNA was pelleted and washed with 70 % ethanol. The DNA was then RNAse and proteinase K treated. Finally the DNA was washed using buffers AW1 and AW2 (QIAmp Fast DNA Stool Mini kit) and eluted in 200 μl of ATE buffer (QIAmp Fast DNA Stool Mini kit).
PCR amplification and preparation for next generation 16S rRNA gene sequencing
PCR reactions contained 25 μl Biomix Red (MyBio, Kilkenny, Ireland), 1 μl forward primer (Sigma Aldrich, Dublin, Ireland) (10pmol), 1 μl reverse primer (Sigma Aldrich) (10pmol), template DNA (64 ng) and PCR grade water (MyBio). PCR conditions were as follows: V4-V5 primer set: heated lid 110 °C, 94 °C × 3mins, followed by 35 cycles of 94 °C × 45 s, 67 °C × 1 min, 72 °C × 1 min, followed by 72 °C × 2mins and held at 4 °C. For V1-V2 primer set 1: heated lid 110 °C, 94 °C × 2mins, followed by 25 cycles of 94 °C × 1 min, 67 °C × 45 s, 72 °C × 1 min, followed by 72 °C × 2mins and held at 4 °C. Twenty five cycles was chosen, as higher cycle numbers gave non-specific bands. For V1-V2 degenerate primer set 2: heated lid 110 °C, 94 °C × 2mins, followed by 35 cycles of 94 °C × 1 min, 64 °C × 45 s, 72 °C × 1 min, followed by 72 °C × 2mins and held at 4 °C. All PCR reactions were completed in triplicate. Negative controls, where DNA was replaced by PCR grade water, were run for each primer set, with no amplification occurring. Triplicate PCR products were pooled and cleaned using AMPure magnetic bead-based purification system (Beckman Coulter, UK). Cleaned samples were quantified using Picogreen Quant-iT quantification and the Nanodrop 3300 (Fisher Scientific, Dublin, Ireland). To confirm purity and primer specificity of the PCR reactions, samples were analysed using the Agilent Bioanalyser. Samples were subsequently pooled in an equimolar concentration and prepared for sequencing using standard protocols. For MiSeq sequencing, libraries were mixed with Illumina generated PhiX control libraries (20 % of 12.5pM solution) and were denatured using freshly prepared NaOH. Samples were loaded at 6pM and sequenced using a V3 600 cycle kit and our specific 16S rRNA gene sequencing primers. For PGM sequencing, libraries were pooled and loaded at 40pM and were sequenced according to Ion PGM protocols using the Ion 318 v2 chip and the Ion PGM Sequencing 400 kit. Loading concentrations for the respective libraries were as per manufacturer’s recommendations.
Bioinformatic analysis
Reads for the MiSeq were merged using the QIIME (version 1.8) script join_paired_ends.py and the fastq-join method [28], however this was not required for PGM reads as they were single-ended. The QIIME script split_libraries.py was used to demultiplex both MiSeq and PGM reads with default parameters, however, only reads matching the main length distribution; MiSeq: V1-V2 primers (305–325 bp), V4-V5 primer (365–385 bp) and PGM: V1-V2 primers (335–355 bp), and V4-V5 primer (380–400 bp) and reads with a minimum average quality score of Q25 were retained. Chimeric sequences were removed via USEARCH version 7.0.1090 using the uchime_ref.py script and the ChimeraSlayer GOLD database [29]. The Mothur implementation of the Ribosomal Database Project (RDP) classifier was used to assign taxonomy from phylum to genus [30] with a bootstrap cut-off of 50 %. Any sequences outside this cut-off were assigned as unclassified at that particular rank.
Species classification along with Clostridium Cluster classification was obtained by utilising the species classifier SPINGO version 1.2 with default parameters [31]. The quality filtered sequence reads for each technology and primer set were inputted into SPINGO and the results were summarised using the script spingo_summary.py included with the software. Heat maps were generated in R version 3.1.3. The function heatmap.2 was performed on the mock cell and mock DNA samples with only the expected species included. Hierarchical clustering was conducted using hclust.
Abbreviations
PBS, phosphate buffered saline; RBB, repeat bead beating; RDP, ribosomal database project.
References
De Filippo C, Cavalieri D, Di Paola M, Ramazzotti M, Poullet JB, Massart S, Collini S, Pieraccini G, Lionetti P. Impact of diet in shaping gut microbiota revealed by a comparative study in children from Europe and rural Africa. Proc Natl Acad Sci. 2010;107(33):14691–7.
Fouhy F, Guinane CM, Hussey S, Wall R, Ryan CA, Dempsey EM, Murphy B, Ross RP, Fitzgerald GF, Stanton C. High-throughput sequencing reveals the incomplete, short-term, recovery of the infant gut microbiota following parenteral antibiotic treatment with ampicillin and gentamycin. Antimicrob Agents Chemother. 2012;56(11):5811–20.
Murphy E, Cotter P, Healy S, Marques T, O’Sullivan O, Fouhy F, Clarke S, O'Toole P, Quigley E, Stanton C. Composition and energy harvesting capacity of the gut microbiota: relationship to diet, obesity and time in mouse models. Gut. 2010;59(12):1635–42.
Turnbaugh PJ, Hamady M, Yatsunenko T, Cantarel BL, Duncan A, Ley RE, Sogin ML, Jones WJ, Roe BA, Affourtit JP. A core gut microbiome in obese and lean twins. Nature. 2008;457(7228):480–4.
Shendure J, Ji H. Next-generation DNA sequencing. Nat Biotechnol. 2008;26(10):1135–45.
Rothberg JM, Hinz W, Rearick TM, Schultz J, Mileski W, Davey M, Leamon JH, Johnson K, Milgrew MJ, Edwards M. An integrated semiconductor device enabling non-optical genome sequencing. Nature. 2011;475(7356):348–52.
Glenn TC. Field guide to next-generation DNA sequencers. Mol Ecol Resour. 2011;11(5):759–69.
Liu L, Li Y, Li S, Hu N, He Y, Pong R, Lin D, Lu L, Law M. Comparison of next-generation sequencing systems. J Biomed Biotechnol. 2012;2012(7):251364. doi:10.1155/2012/251364.
Mardis ER. Next-generation DNA sequencing methods. Annu Rev Genomics Hum Genet. 2008;9:387–402.
Shokralla S, Spall JL, Gibson JF, Hajibabaei M. Next-generation sequencing technologies for environmental DNA research. Mol Ecol. 2012;21(8):1794–805.
Weinstock GM. Genomic approaches to studying the human microbiota. Nature. 2012;489(7415):250–6.
Raoult D, Henrissat B. Are stool samples suitable for studying the link between gut microbiota and obesity? Eur J Epidemiol. 2014;29(5):307–9.
Fouhy F, Deane J, Rea MC, O’Sullivan Ó, Ross RP, O’Callaghan G, Plant BJ, Stanton C. The effects of freezing on faecal microbiota as determined using MiSeq sequencing and culture-based investigations. PLoS One. 2015;10(3), e0119355.
Kennedy NA, Walker AW, Berry SH, Duncan SH, Farquarson FM, Louis P, Thomson JM, Ahmad T, Satsangi J, Flint HJ. The impact of different DNA extraction kits and laboratories upon the assessment of human gut microbiota composition by 16s rRNA gene sequencing. PLoS One. 2014;9(2), e88982.
Nechvatal JM, Ram JL, Basson MD, Namprachan P, Niec SR, Badsha KZ, Matherly LH, Majumdar AP, Kato I. Fecal collection, ambient preservation, and DNA extraction for PCR amplification of bacterial and human markers from human feces. J Microbiol Methods. 2008;72(2):124–32.
Haas BJ, Gevers D, Earl AM, Feldgarden M, Ward DV, Giannoukos G, Ciulla D, Tabbaa D, Highlander SK, Sodergren E. Chimeric 16S rRNA sequence formation and detection in Sanger and 454-pyrosequenced PCR amplicons. Genome Res. 2011;21(3):494–504.
Walker AW, Martin JC, Scott P, Parkhill J, Flint HJ, Scott KP. 16S rRNA gene-based profiling of the human infant gut microbiota is strongly influenced by sample processing and PCR primer choice. Microbiome. 2015;3(1):1–11.
Schirmer M, Ijaz UZ, D’Amore R, Hall N, Sloan WT, Quince C. Insight into biases and sequencing errors for amplicon sequencing with the Illumina MiSeq platform. Nucleic Acids Res. 2015;43:gku1341.
Salipante SJ, Kawashima T, Rosenthal C, Hoogestraat DR, Cummings LA, Sengupta DJ, Harkins TT, Cookson BT, Hoffman NG. Performance comparison of Illumina and ion torrent next-generation sequencing platforms for 16S rRNA-based bacterial community profiling. Appl Environ Microbiol. 2014;80(24):7583–91.
Yu Z, Morrison M. Improved extraction of PCR-quality community DNA from digesta and fecal samples. Biotechniques. 2004;36(5):808–13.
Claesson MJ, Wang Q, O’Sullivan O, Greene-Diniz R, Cole JR, Ross RP, O'Toole PW. Comparison of two next-generation sequencing technologies for resolving highly complex microbiota composition using tandem variable 16S rRNA gene regions. Nucleic Acids Res. 2010;38:gkq873.
Tremblay J, Singh K, Fern A, Kirton ES, He S, Woyke T, Lee J, Chen F, Dangl JL, Tringe SG. Primer and platform effects on 16S rRNA tag sequencing. Front Microbiol. 2015;6:771. doi:10.3389/fmicb.2015.00771.
Caporaso JG, Lauber CL, Walters WA, Berg-Lyons D, Huntley J, Fierer N, Owens SM, Betley J, Fraser L, Bauer M. Ultra-high-throughput microbial community analysis on the Illumina HiSeq and MiSeq platforms. ISME J. 2012;6(8):1621–4.
Nelson MC, Morrison HG, Benjamino J, Grim SL, Graf J. Analysis, optimization and verification of Illumina-generated 16S rRNA gene amplicon surveys. PLoS One. 2014;9(4), e94249.
McOrist AL, Jackson M, Bird AR. A comparison of five methods for extraction of bacterial DNA from human faecal samples. J Microbiol Methods. 2002;50(2):131–9.
Salonen A, Nikkilä J, Jalanka-Tuovinen J, Immonen O, Rajilić-Stojanović M, Kekkonen RA, Palva A, de Vos WM. Comparative analysis of fecal DNA extraction methods with phylogenetic microarray: effective recovery of bacterial and archaeal DNA using mechanical cell lysis. J Microbiol Methods. 2010;81(2):127–34.
Claesson MJ, Cusack S, O’Sullivan O, Greene-Diniz R, de Weerd H, Flannery E, et al. Composition, variability, and temporal stability of the intestinal microbiota of the elderly. Proc Natl Acad Sci. 2011;108(Supplement 1):4586–91.
Aronesty E. Comparison of sequencing utility programs. Open Bioinforma J. 2013;7:1–8.
Edgar RC, Haas BJ, Clemente JC, Quince C, Knight R. UCHIME improves sensitivity and speed of chimera detection. Bioinformatics. 2011;27(16):2194–200.
Schloss PD, Westcott SL, Ryabin T, Hall JR, Hartmann M, Hollister EB, Lesniewski RA, Oakley BB, Parks DH, Robinson CJ, et al. Introducing mothur: open-source, platform-independent, community-supported software for describing and comparing microbial communities. Appl Environ Microbiol. 2009;75(23):7537–41.
Allard G, Ryan FJ, Jeffery IB, Claesson MJ. SPINGO: a rapid species-classifier for microbial amplicon sequences. BMC Bioinf. 2015;16(1):324.
Acknowledgements
The authors wish to thank Dr. Fiona Crispie and Ms. Vicki Murray for their extensive help with the sequencing in this study.
Funding
This publication has emanated from research supported in part by a research grant from Science Foundation Ireland (SFI) under Grant Numbers SFI/12/RC/2273 and 11/PI/1137 and by FP7 funded CFMATTERS (Cystic Fibrosis Microbiome-determined Antibiotic Therapy Trial in Exacerbations: Results Stratified, Grant Agreement no. 603038).
The funding agencies had no role in the design or execution of the experiments or in the preparation of the manuscript.
Availability of data and material
Sequence data are available from the NCBI Short Read Archive. The accession number is SRP071776.
Authors’ contributions
FF was involved in study design, conducted the lab experiments, was involved in the data analysis and interpretation and wrote the manuscript. AC was involved in data analysis and interpretation and writing the manuscript. CS was involved in study design, interpretation of the results and manuscript preparation. MC was involved in the study design, data analysis and interpretation and drafting of the manuscript. PC was involved in study design, interpretation of the results and preparation of the manuscript. All authors read and approved the final manuscript.
Competing interests
The authors declare that they have no competing interests.
Consent for publication
Not applicable.
Ethics approval and consent to participate
Ethical approval was not required for this work as no human or animal samples and/or data were analysed in this study.
Author information
Authors and Affiliations
Corresponding authors
Additional file
Additional file 1: Table S1.
Percentage relative abundance of expected species detected in the mock cell DNA. (DOCX 21 kb)
Rights and permissions
Open Access This article is distributed under the terms of the Creative Commons Attribution 4.0 International License (http://creativecommons.org/licenses/by/4.0/), which permits unrestricted use, distribution, and reproduction in any medium, provided you give appropriate credit to the original author(s) and the source, provide a link to the Creative Commons license, and indicate if changes were made. The Creative Commons Public Domain Dedication waiver (http://creativecommons.org/publicdomain/zero/1.0/) applies to the data made available in this article, unless otherwise stated.
About this article

Cite this article
Fouhy, F., Clooney, A.G., Stanton, C. et al. 16S rRNA gene sequencing of mock microbial populations- impact of DNA extraction method, primer choice and sequencing platform. BMC Microbiol 16, 123 (2016). https://doi.org/10.1186/s12866-016-0738-z
Received:
Accepted:
Published:
DOI: https://doi.org/10.1186/s12866-016-0738-z